|
|
PowerPlotDIL1 |
|

SINQ LIN LIN
SINQ Wiki
This Page
Referenced by
Wiki Info
JSPWiki v2.0.52
|
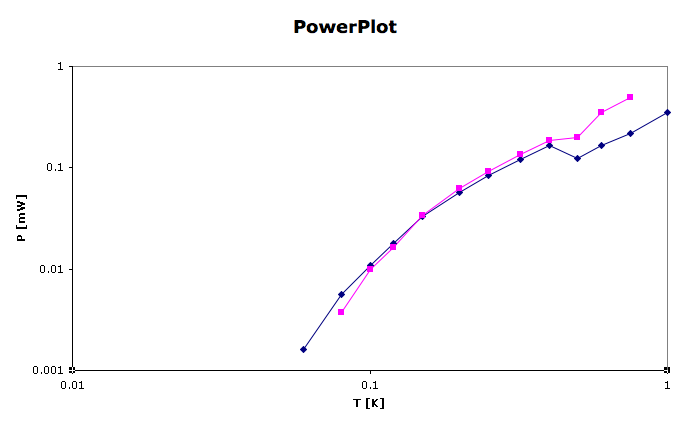
Power Plot DIL1Measured 18. Feb. 09 at increasing (a) and decreasing (b) T
Attachments: PowerPlot.png Printer Friendly Page Info This page last changed on 19-Feb-2009 08:30:24 UTC by MarkusZolliker. |