|
|
NeutronWWW |
|

SINQ LIN LIN
SINQ Wiki
This Page
Referenced by
Wiki Info
JSPWiki v2.0.52
|
Interacting with the SinqHM softwareThe server side software on the histogram memories is actually a WWW-server. It not only serves SICS to do its job but it also has a nice WWW interface which allows to debug neutron data acquisition from a WWW browser. This document details how to do this and which information can be gained.
Connecting to the SinqHM WWW-serverA little bit complicated due to firewalls etc.
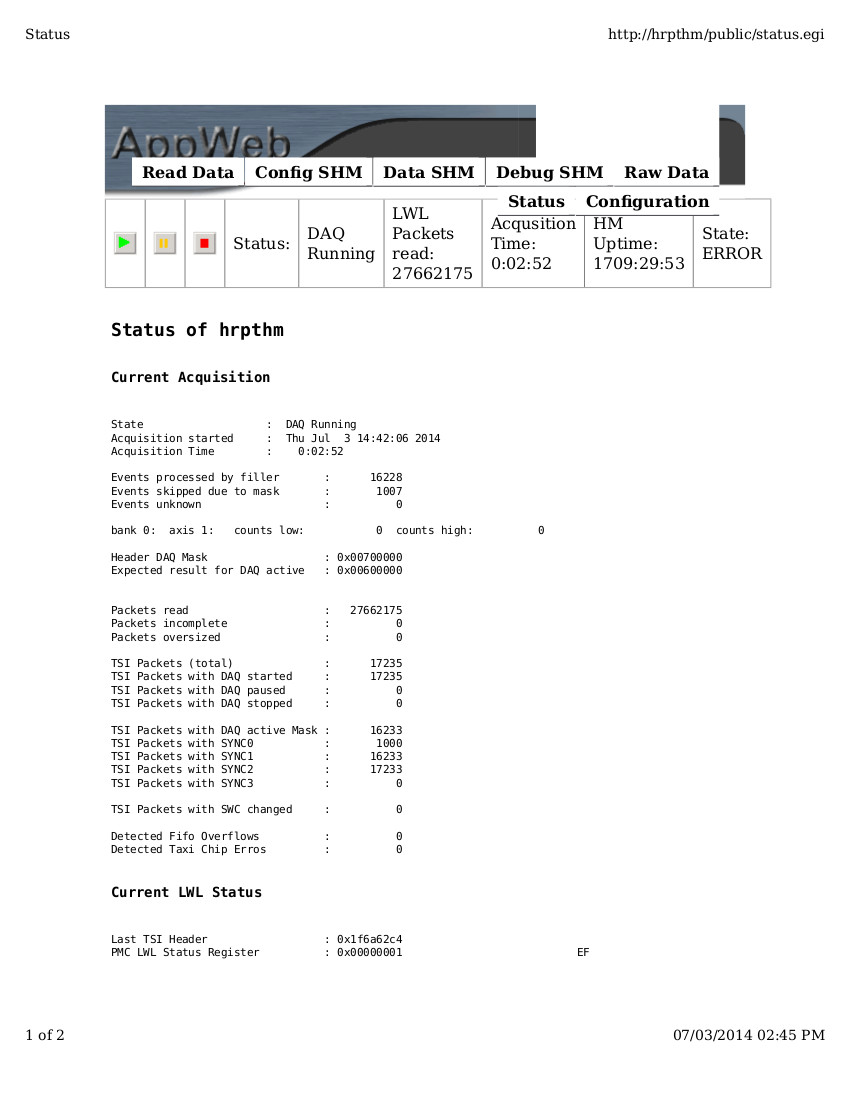
The SinqHM Status PageChoose the status tab on the WWW interface. You get a page like below from which some things can already be learned.
There is this line reading: Events processed by filler When DAQ is active, the associated number should increase continuously. Even with SINQ off there should be events any few seconds. If nothing is coming here, then the electronics does not send neutron events. The next line reading Events skipped due to mask is interesting too. This will continuously increase when the HM sees events where the sync bits are not OK. A small percentage of all neutron events occuring here is OK. But if all events come here, something is wrong. Scroll down further, and you can see which sync bit is triggered. But there is only a channel number. What is plugged in there, ask the electronics guys.
Then there is a line or lines reading something like: bank 0: axis 1: counts low: 0 counts high: 0 Such lines show if there are events outside of the histogramming limits for this axis. For normal, physical detector axis like x or y, this should be low numbers of neutron events, ideally 0. If this is not the case, something is wrong: either the electronics delivers phony numbers of the configuration of the HM is wrong. Check the configuration page. For TOF axes it is normal that some percentage of the neutron events are outside of the time binning range. But if a large number of events is outside, scold the user because she configured an unsuitable time binning. If any of the counters: Events unknown, Packets incomplete or Packets oversized keeps increasing, then the electronics is sending bad packets on the fibre optics link. After SINQ startup this might actually have a high count, when there is no electronics switched on or if the fibre optics link is disconnected this increases too. Due to noise. To be sure, reboot the HM and observe what happens. Then there is the counter with the TSI packets. TSI packets are Time Status Information packets which are sent by the MDI at regular time intervalls. They contain status information from the electronics. No matter what, this counter should increase slowly over time. If not, the detector electronics is either switched off or broken. In the latter case, raise an alarm with electronics guys. This is no longer a software problem. There are other counters here: Detected Fifo Overflows, Detected Taxi Chip Errors. If these increase, either the fibre optic link has been disconnected or the Mezanine card for reading the fibre optic link into the HM is broken. Again a problem for the electronics group; not software.
The Configuration PageThis page shows the current configuration as known to the HM. It may be useful to look at this when there is the assumption that the configuration is not properly transferred by SICS. BTW: if there is such a problem: SICS compiles the XML configuration with a script. The script name can be found by looking at the initscript parameter of the HM in SICS.
The Debug SHM TabThis page shows error messages from the HM software itself. There is rarely something intersting to be found here: the HM software is stable since years.
The Raw Data TabFrom this tab, it is possible to look at the raw neutron event messages as they come in from the fibre optic link. This is sometimes useful for debugging purposes. When you enable Show Packet Info, the packest will be unpacked into a readable form. Otherwise interpreting the packets is a binary black art especially as there is not much documentation about the packet format besides the source code of the SinqHM software. Please note: the WWW-interface works best with firefox; events will only be shown after restarting DAQ.
Attachments: hrpthmstatus.jpg hrpthmstatus.pdf Printer Friendly Page Info This page last changed on 04-Jul-2014 12:08:39 UTC by MarkKoennecke. |